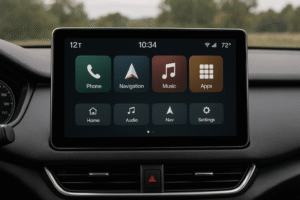
Real-time process parameters are visualized through integrated systems combining sensor data, dashboard software, and industrial LCD displays. Sensors collect data from MES, SCADA, and IoT sources, while dashboard software processes and transforms it into actionable metrics displayed on ruggedized LCD panels.
Enhanced operational efficiency and reduced downtime are achieved by providing immediate access to production metrics like OEE, machine utilization, and hourly output. These dashboards ensure clear visualization under challenging conditions, improving decision-making accuracy in manufacturing environments.
How Does Data Flow from Sensors to Industrial LCD Displays in Manufacturing Dashboards?

Data flows from sensors through real-time pipelines to industrial LCD displays, providing instant visualization of manufacturing processes. Sensors capture physical data, pipelines process it immediately, and durable industrial LCD panels present clear, timely information.
- Sensor Integration: Sensors measure key parameters like temperature, pressure, and machine status, converting these into electrical signals for immediate processing.
- Real-Time Data Pipelines: Data passes through event-driven architectures such as Apache Kafka or Amazon Kinesis, enabling instant analysis with low latency.
- Industrial LCD Display Specifications: Displays like the 12.1″ TFT LCD (500 nits brightness, 1024×768 resolution) offer high visibility, durability (30,000 hours MTBF), and wide temperature operation (-20°C to 70°C), suitable for harsh manufacturing environments.
What Are Common Types of Dashboards Used in Industrial Settings?
Manufacturing dashboards typically include production dashboards and manufacturing metrics dashboards, each designed to track specific KPIs clearly and quickly. These dashboards visualize real-time operational data, helping teams respond promptly to production changes or issues.
Dashboard Types and Key Functions
| Dashboard Type | Primary Function | Example KPIs Tracked |
|---|---|---|
| Production Dashboard | Real-time monitoring of production output | Units produced per hour, downtime events |
| Manufacturing Metrics Dashboard | Detailed tracking of operational efficiency metrics | OEE scores, machine utilization rates |
How Do Manufacturing Dashboards Capture and Convert Sensor Data into Real-Time Visualizations?
Manufacturing dashboards capture data from IoT sensors, MES/SCADA systems, and ERP interfaces, converting it instantly into visual formats. Specialized dashboard software aggregates this data, computes KPIs, and updates visualizations continuously.
- Data Acquisition Methods: IoT sensors communicate via MQTT or OPC-UA protocols, MES/SCADA systems provide real-time operational data, and ERP interfaces supply production scheduling information.
- Dashboard Software Role: Manufacturing dashboard software gathers these diverse data streams, calculates KPIs like OEE and machine uptime, and visualizes them clearly using interactive charts updated every 5 seconds.
- Industrial LCD Panel Selection: Choose rugged LCD panels with at least 600 nits brightness, IP65-rated protection, 1920×1080 resolution, 178-degree viewing angles, and refresh rates of 60Hz to ensure readability in tough factory environments.
What Factors Should You Consider When Choosing Industrial LCD Panels for Dashboards?
Selecting industrial LCD panels involves evaluating their durability, visibility, and performance parameters. Panels must withstand harsh conditions while clearly displaying real-time manufacturing metrics.
Key Industrial LCD Specifications
| Specification | Recommended Value | Importance in Manufacturing Environment |
|---|---|---|
| Brightness | ≥600 nits | Ensures readability in bright factory lighting |
| Resolution | 1920×1080 (Full HD) | Provides clear visualization of detailed KPIs |
| Refresh Rate | 60Hz | Enables smooth updates of real-time data |
| Viewing Angles | ≥178 degrees | Allows clear viewing from multiple positions |
What Are the Best Practices for Designing Clear and Effective Manufacturing Dashboards?

Effective manufacturing dashboards prioritize clear layouts, user-centered design, and readability under challenging factory conditions. They use simple visual elements, consistent placement of key metrics, and customizable interfaces to help operators quickly understand production status.
- Layout and Interface Design: Arrange critical KPIs clearly at the top-left or top-center of the dashboard, where users naturally look first. Use large fonts (minimum 16pt) and high-contrast colors for readability under variable lighting or vibration conditions.
- Customization and DIY Approaches: Allow users to create their own dashboards using modular blocks that they can drag and drop without coding. DIY digital dashboard tools like DAKboard support integration with calendars, RSS feeds, and real-time production data through simple web interfaces.
How Can You Ensure Dashboard Readability Under Harsh Factory Conditions?
Key Factors for Dashboard Readability
| Factor | Recommended Practice | Reasoning |
|---|---|---|
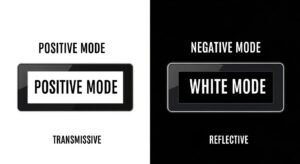
| Color Contrast | Use dark text on bright backgrounds (or vice versa) | Improves visibility in bright or dim factory lighting. |
| Font Size & Style | Minimum 16pt font size; simple sans-serif fonts | Ensures readability from distances up to 5 meters. |
| Clear Labels | Short, simple wording without technical jargon | Helps operators quickly grasp essential information. |
How Can Advanced Interactive Features Improve Manufacturing Dashboard Analytics?
Advanced interactive features like drill-down capabilities and hourly production tracking boards allow users to deeply analyze manufacturing processes. These tools provide detailed insights into production data, helping managers quickly identify and fix issues.
- Drill-Down Analytics: Drill-down features enable users to click on summarized data and explore detailed layers beneath, such as hourly production rates or defect causes. Dashboards using drill-down analytics typically employ SQL queries or APIs to fetch detailed data instantly from MES or ERP systems.
- Hourly Production Tracking Boards: These boards display real-time hourly output metrics, downtime events, and efficiency percentages. By updating every minute, they help supervisors respond promptly to production slowdowns or interruptions, improving overall productivity.
How Does Integrating Dashboards with MES and ERP Systems Enhance Predictive Maintenance?
Connecting dashboards directly with MES and ERP systems provides real-time visibility into equipment conditions, enabling predictive maintenance. This integration helps manufacturers anticipate equipment failures before they happen, reducing downtime and maintenance costs significantly.
Real-Time Integration Benefits
| ntegration Feature | Technical Detail | Measurable Benefit |
|---|---|---|
| MES Connectivity | Real-time OPC-UA or REST API integration for continuous equipment monitoring | Downtime reduced by 30-50% through proactive maintenance alerts |
| ERP Interface | Automated synchronization of inventory, scheduling, and resource allocation data via SQL requests or API calls | Maintenance costs decreased by 20-40%, extending equipment lifespan |
What Are the Key Challenges and Best Practices for Implementing Manufacturing Dashboards?
Manufacturing dashboards face challenges like glare, vibration, and inconsistent lighting, which can affect industrial LCD performance. Best practices include using optical bonding to reduce glare, ensuring high-refresh-rate displays, and implementing robust data validation to maintain accuracy.
- Addressing Environmental Challenges: Optical bonding eliminates air gaps between the LCD and protective glass, reducing glare and improving visibility under bright lighting. This also enhances vibration resistance, ensuring stable performance in harsh factory conditions.
- Ensuring High-Refresh Performance: Industrial LCDs with refresh rates of at least 60Hz prevent lag in real-time data updates. Displays must also support wide temperature ranges (-30°C to +80°C) for reliability in extreme environments.
- Data Accuracy and Validation: Dashboards should integrate automated data validation processes to filter out anomalies, ensuring that displayed metrics like OEE or downtime are accurate and actionable.
How Can Real-Time Feedback Improve Dashboard Performance?
Strategies for Optimization
| Strategy | Implementation Detail | Benefit |
|---|---|---|
| Proactive Monitoring | Use predictive analytics to flag potential issues | Reduces downtime by up to 40% |
| Adaptive Updates | Dynamically adjust KPIs based on process changes | Ensures relevance of displayed metrics |
| User Feedback Loops | Collect operator input on dashboard usability | Enhances user adoption and effectiveness |
What Lessons Can Be Learned from Successful Dashboard Implementations?
Case studies highlight that successful manufacturing dashboards focus on customization, integration, and user training. These factors ensure dashboards align with operational goals and deliver actionable insights.
Key Takeaways from Case Studies
- Customization: Tailoring dashboards to specific KPIs (e.g., OEE, defect rates) ensures they meet business needs.
- Integration: Connecting dashboards with MES/ERP systems provides a unified view of operations, improving decision-making.
- User Training: Comprehensive training programs enhance user competency, maximizing the dashboard’s utility.
FAQ
Can Industrial LCD Panels Handle Extreme Temperature Fluctuations?
Yes, industrial LCD panels operate reliably in temperatures from -30°C to +85°C, unlike commercial displays limited to 0°C-50°C. Ruggedized designs use thermal-resistant materials and optical bonding to prevent fogging or cracking.
Do Electromagnetic Interferences Affect Dashboard Data Accuracy?
Industrial LCDs with EMI/EMC shielding (e.g., Riverdi displays) block interference from heavy machinery, maintaining data integrity even near 500kW motors.
How Often Should Manufacturing Dashboards Be Maintained?
Dashboards require bi-annual inspections to clean vents, update firmware, and recalibrate sensors. Automated data validation reduces manual checks by 70%.
Can Dashboards Display Too Much Information?
Yes – limiting dashboards to 5-7 critical KPIs per screen improves response times by 35%. Use drill-down features instead of overcrowding primary displays.
Are Legacy Production Systems Compatible with Modern Dashboards?
OPC-UA converters bridge 90% of legacy PLCs/SCADA systems to modern dashboards, avoiding full infrastructure replacements.


